Engineering Sensitivity Lab
Which parameters really control the result, and which can you freeze?
Day 16 of the apps series: https://sensitivity.pinneapple.org (source: apps/sensitivity_lab).
Give a model (built-in benchmark, pp.zoo model or ONNX graph), runs done in your solver (OpenFOAM, CalculiX: download
the Saltelli design, upload the results) or a dataset, the parameters with their ranges or distributions and the
responses. The lab returns Sobol first-order, total and second-order indices with bootstrap intervals, Morris
screening, main-effect and ICE curves, local derivatives (automatic differentiation for torch models) and the
parameters you can freeze, each recommendation checked by re-running the model with them fixed.
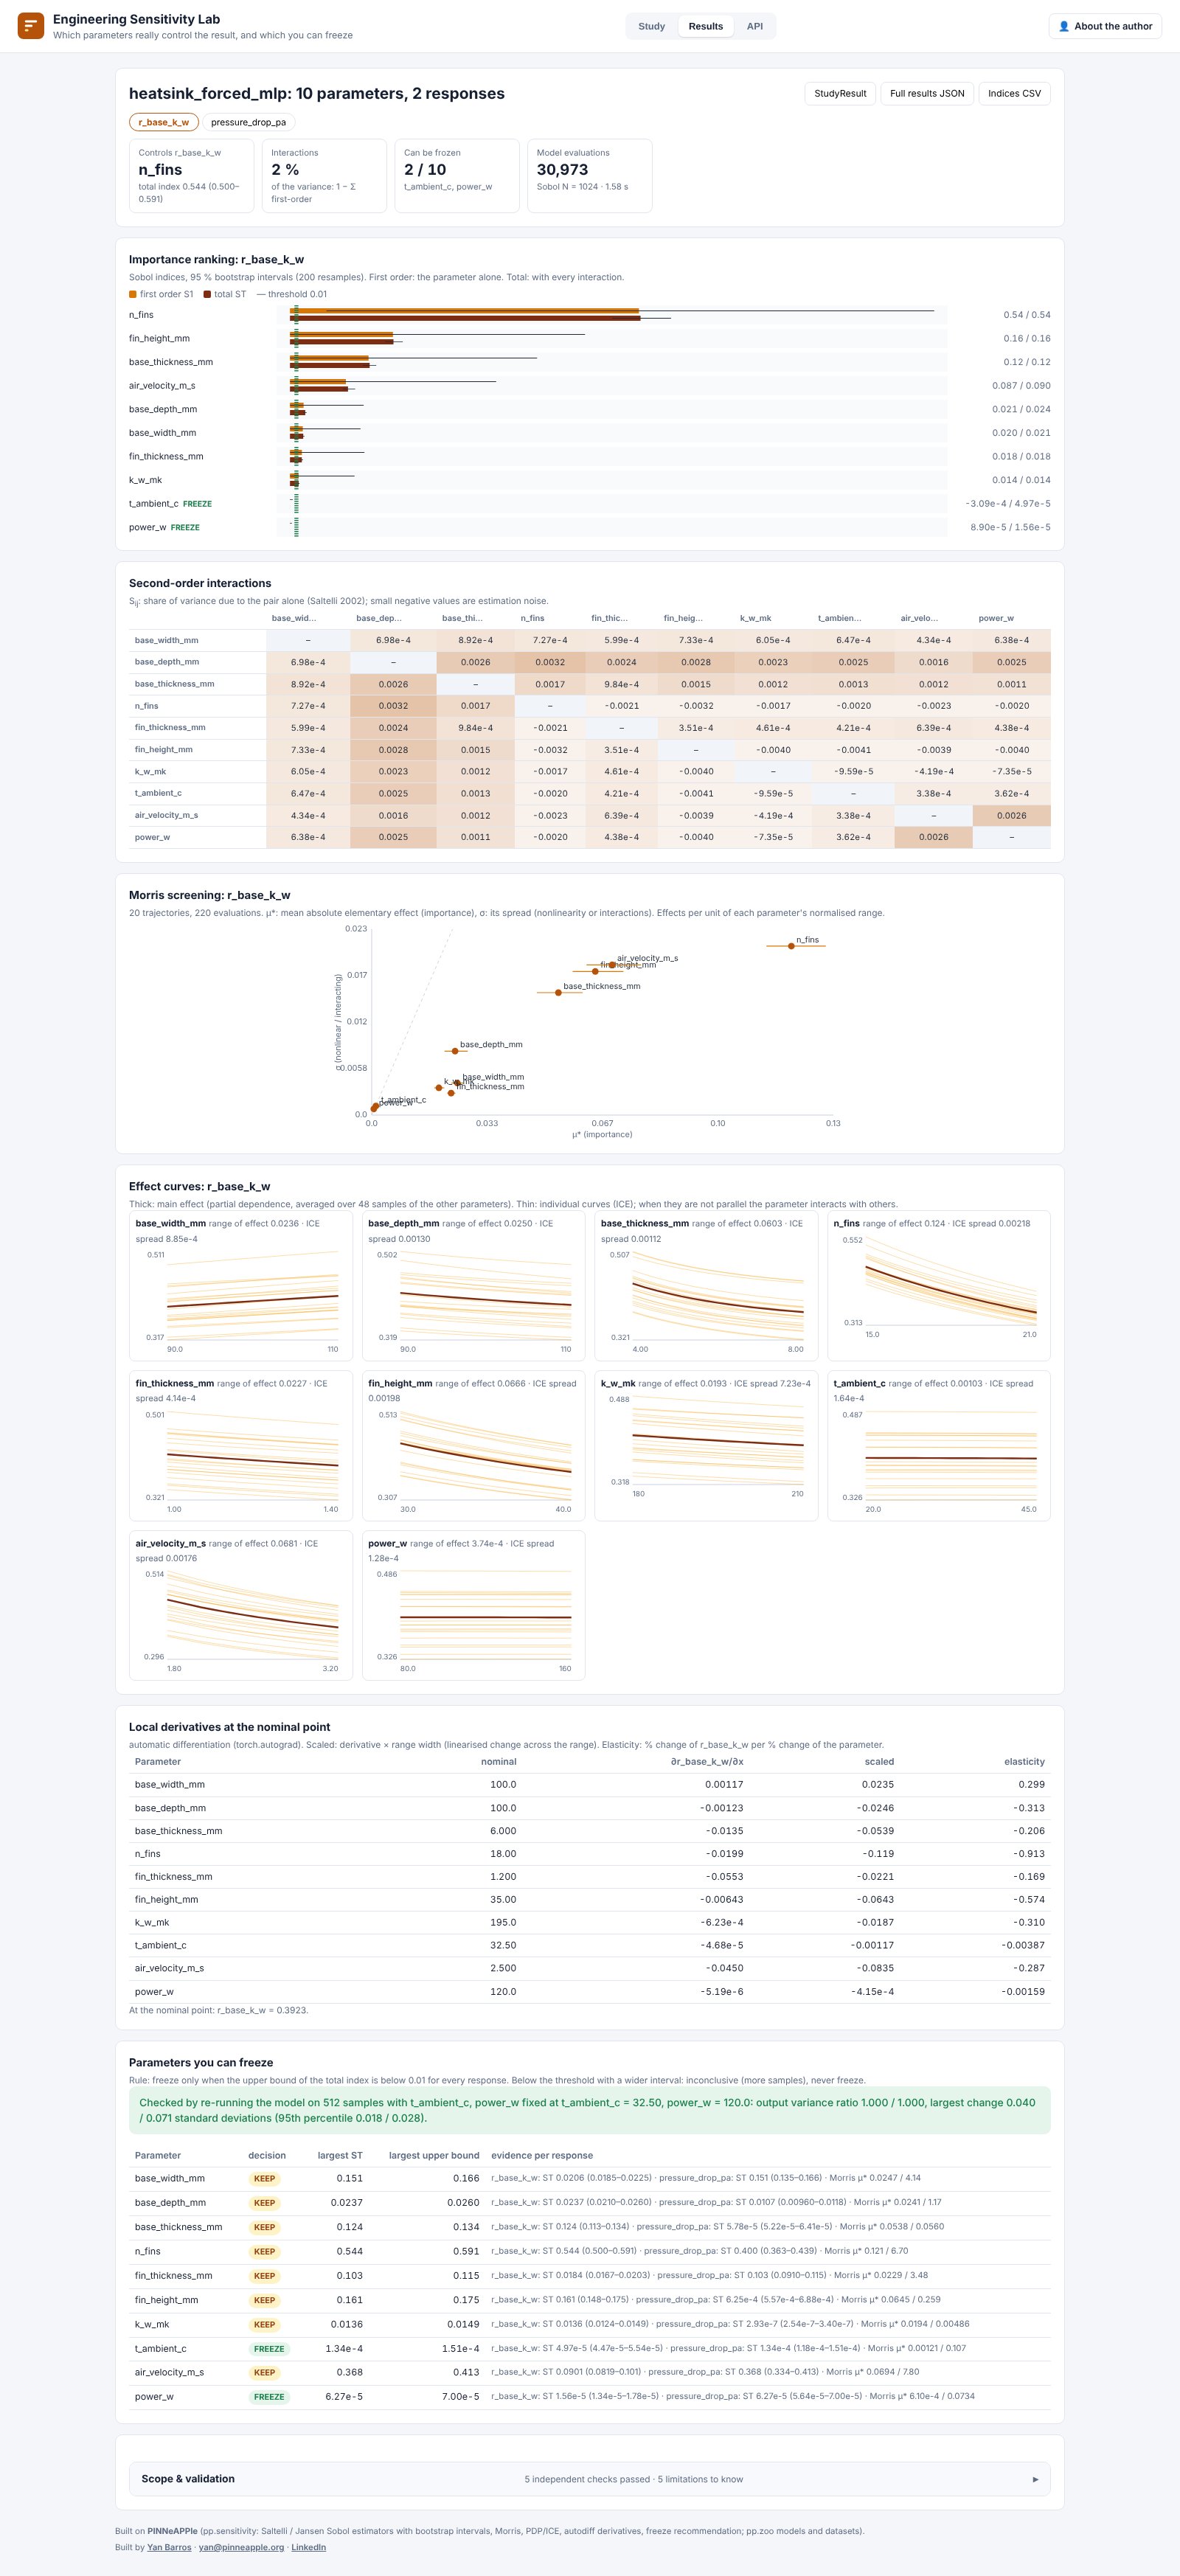
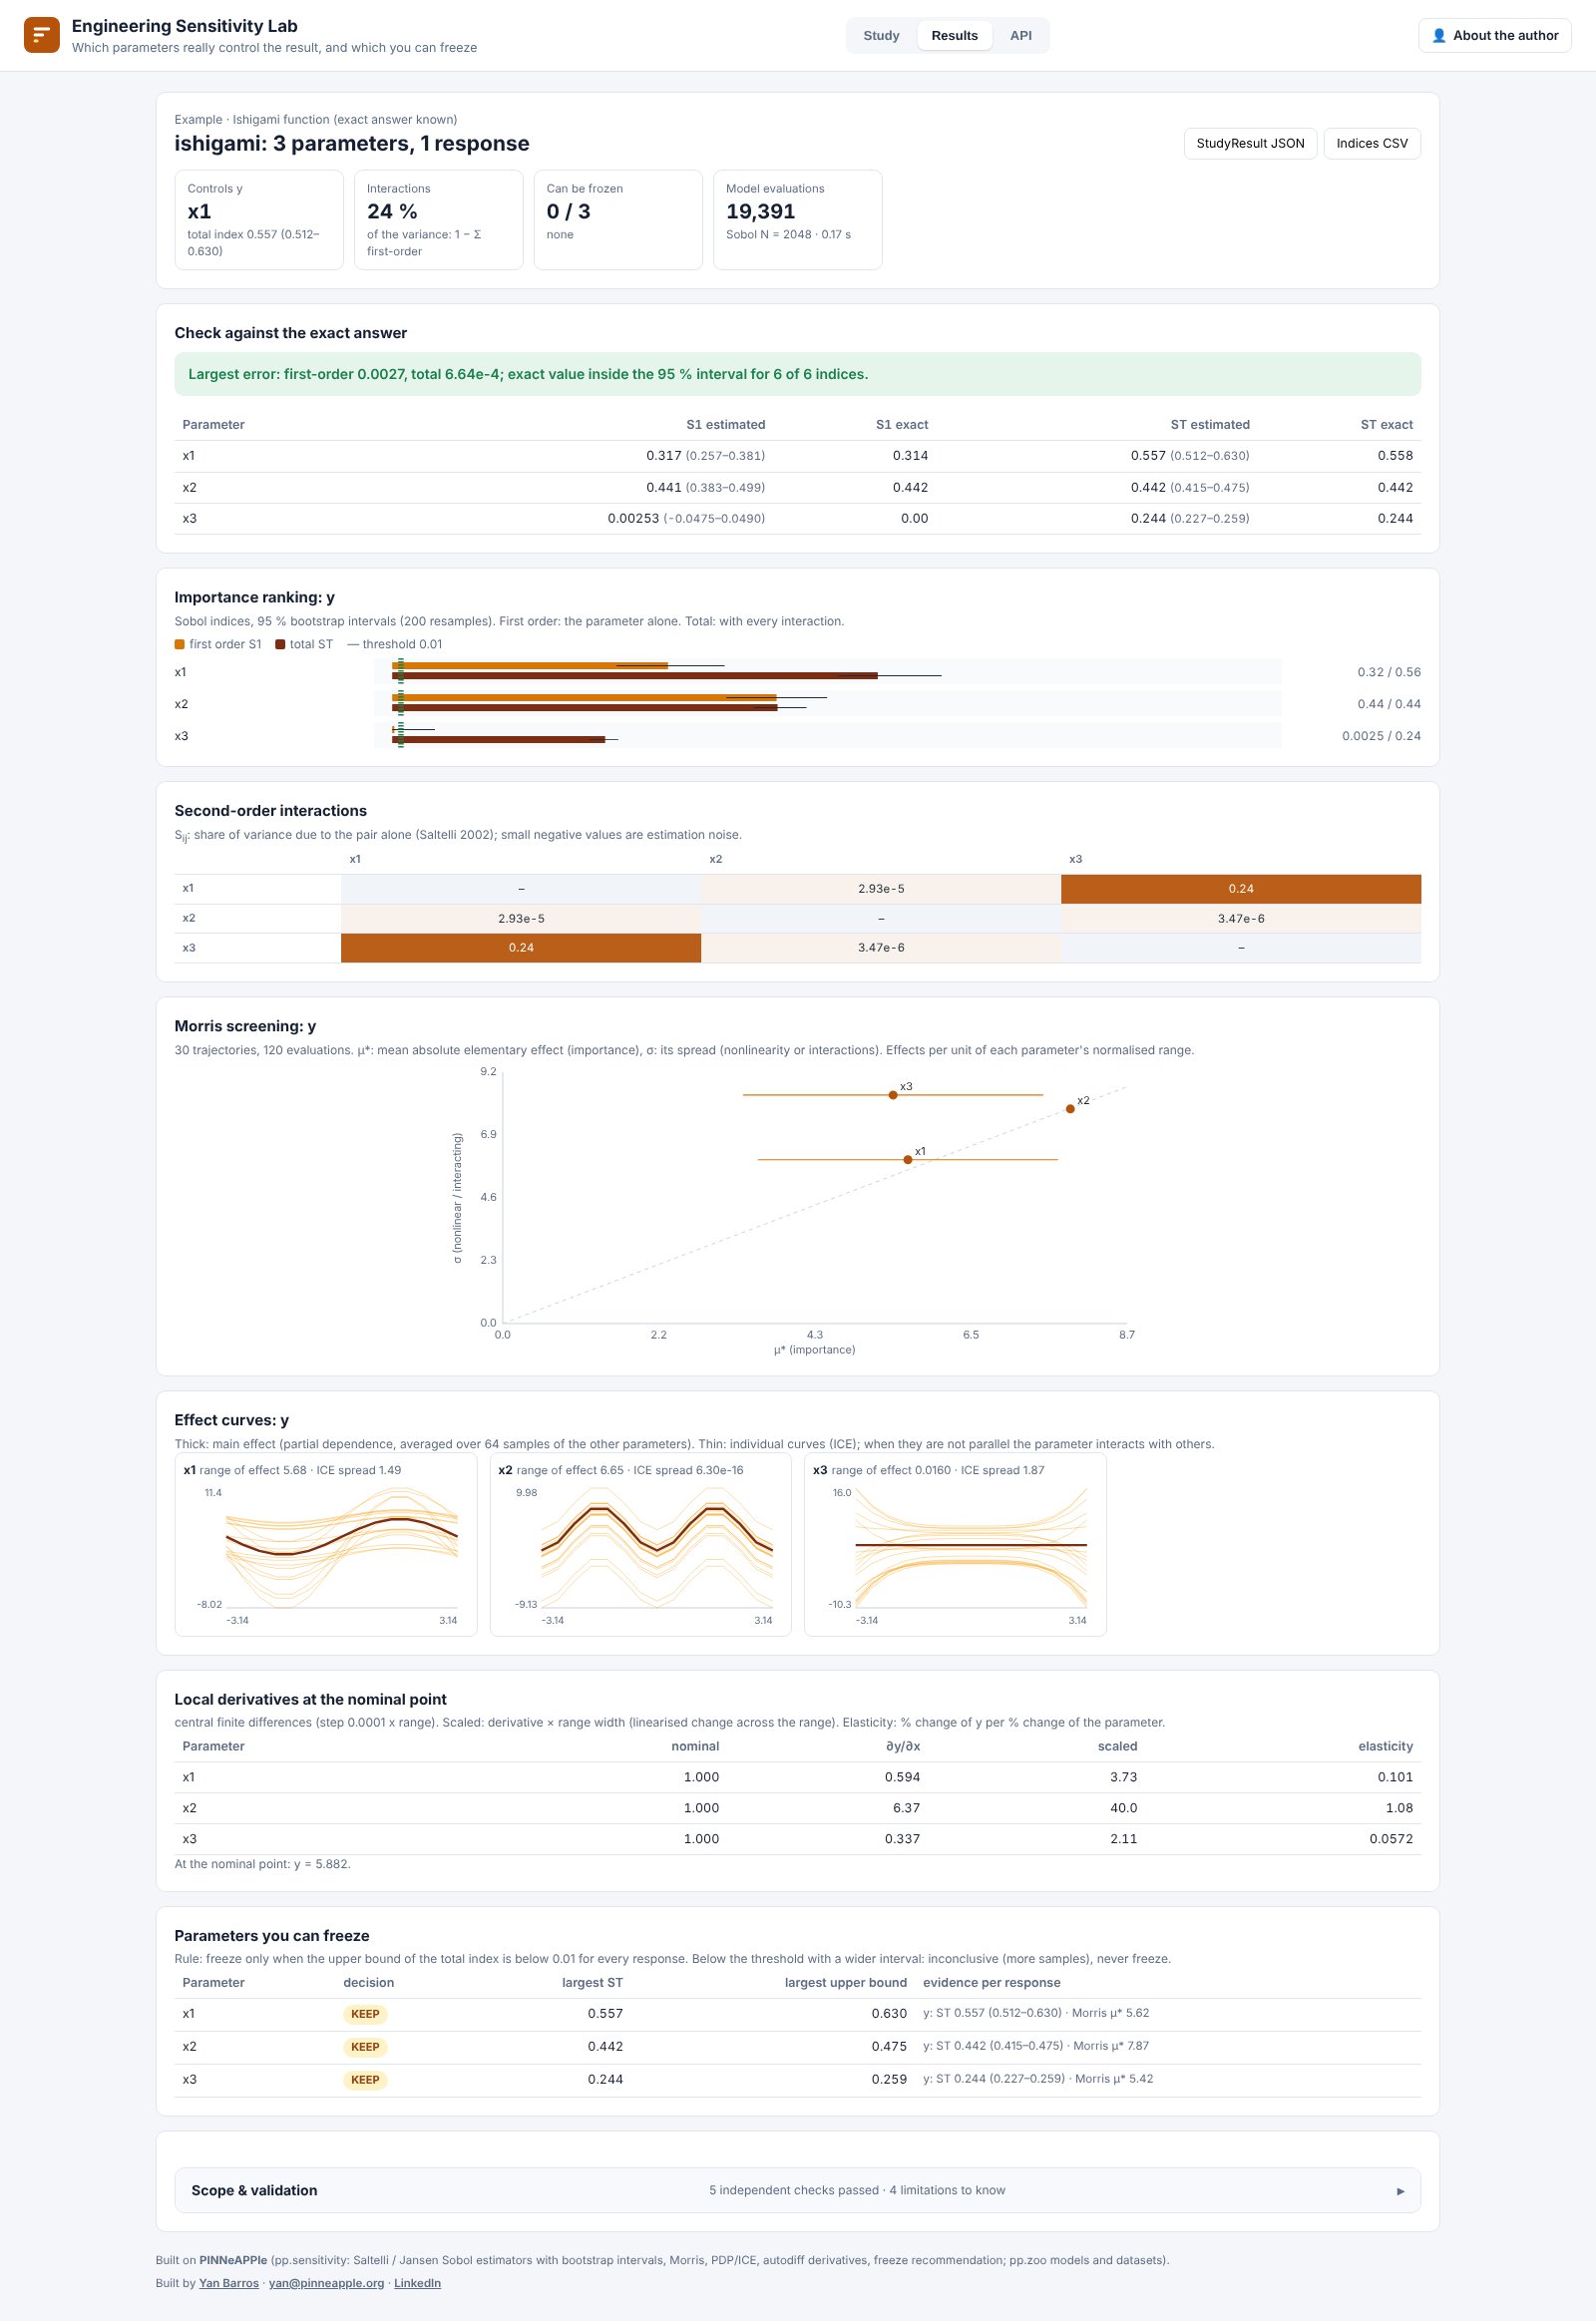
On the Ishigami benchmark every estimated index is within 0.003 of the exact value and inside its 95 % interval. On the heat-sink design, fin count controls the thermal resistance (total index 0.54); ambient temperature and power can be frozen (total index < 2e-4) and fixing them changes the output variance by less than 0.1 %. From data alone (3,900 simulations) the app flags that the inputs are correlated (r = 0.66), so the first-order indices add up to more than 1.
Everything shown comes from pp.sensitivity (see Uncertainty and sensitivity studies on any
model). Limits, methods and the API are in the
app README.